HCube: the app for sports wearables that read the body
An invisible patch sewn into sportswear, and an app that reads its vital signs in real time.

- Year
- 2024
- Client
- HCube (a startup incubated at Politecnico di Torino)
The problem
HCube is a startup incubated at Politecnico di Torino, focused on sports and medical research. The project it conceived and championed is HTee: a patch applied directly to an athlete's clothing that picks up their main vital and performance parameters while they train, across very different sporting conditions. The hardware worked. What was missing was the interface to talk to it.
The brief was precise: an app that collects the data stream coming from the patches, makes it readable in real time and keeps it. Put that way it sounds like a charting problem, and it is in fact a problem of transformation: moving from an instantaneous measurement, which lasts as long as the session, to a sporting profile built up over time, one that in the second month says something it could not have said on the first day.
How we solved it
The app is in Flutter 3.0, a single codebase for iOS and Android. On a consumer product the reason would be cost; here it was two other things. The first is parity: no difference in behaviour between the two platforms when reading a clinical value, because a trace cannot be slightly different depending on which phone you have in your pocket. The second is time: reaching both stores with a time to market compatible with the hardware validation cycles, without the software becoming the bottleneck of a process that depends on something else.
A clinical measurement cannot behave one way on iOS and another on Android.
The delicate point is Bluetooth Low Energy. A continuous high-frequency stream has to stay open without draining the battery, and the connection parameters are exactly the trade-off between latency and consumption: you choose where to sit, you do not get both. The differences between the iOS and Android stacks we closed behind a common abstraction, because that is where the real problems surface: permissions, background behaviour, notification reliability.
On the data pipeline there was one constraint: do not lose precision between the sensor and the chart. Incoming samples accumulate in fixed-size circular buffers, so memory usage stays constant even over a long session, and smoothing algorithms damp movement and contact noise without altering the morphology of the trace. This is where you have to resist the temptation: a more aggressive filter gives back a prettier and less truthful trace, and on a clinical measurement that is the kind of improvement you cannot accept.
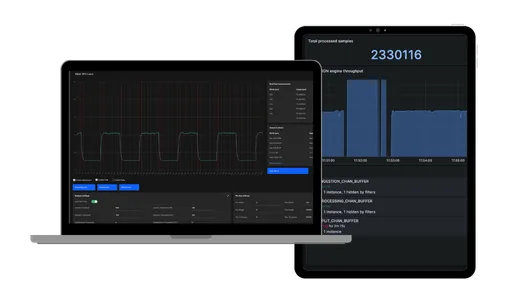
Packet acquisition and parsing sit off the UI thread, because the load of receiving must never turn into a stuttering chart. ECG rendering runs at 60 fps on a custom canvas, redrawing only the visible time window rather than the whole series: that is why the trace stays fluid while the data keeps arriving.
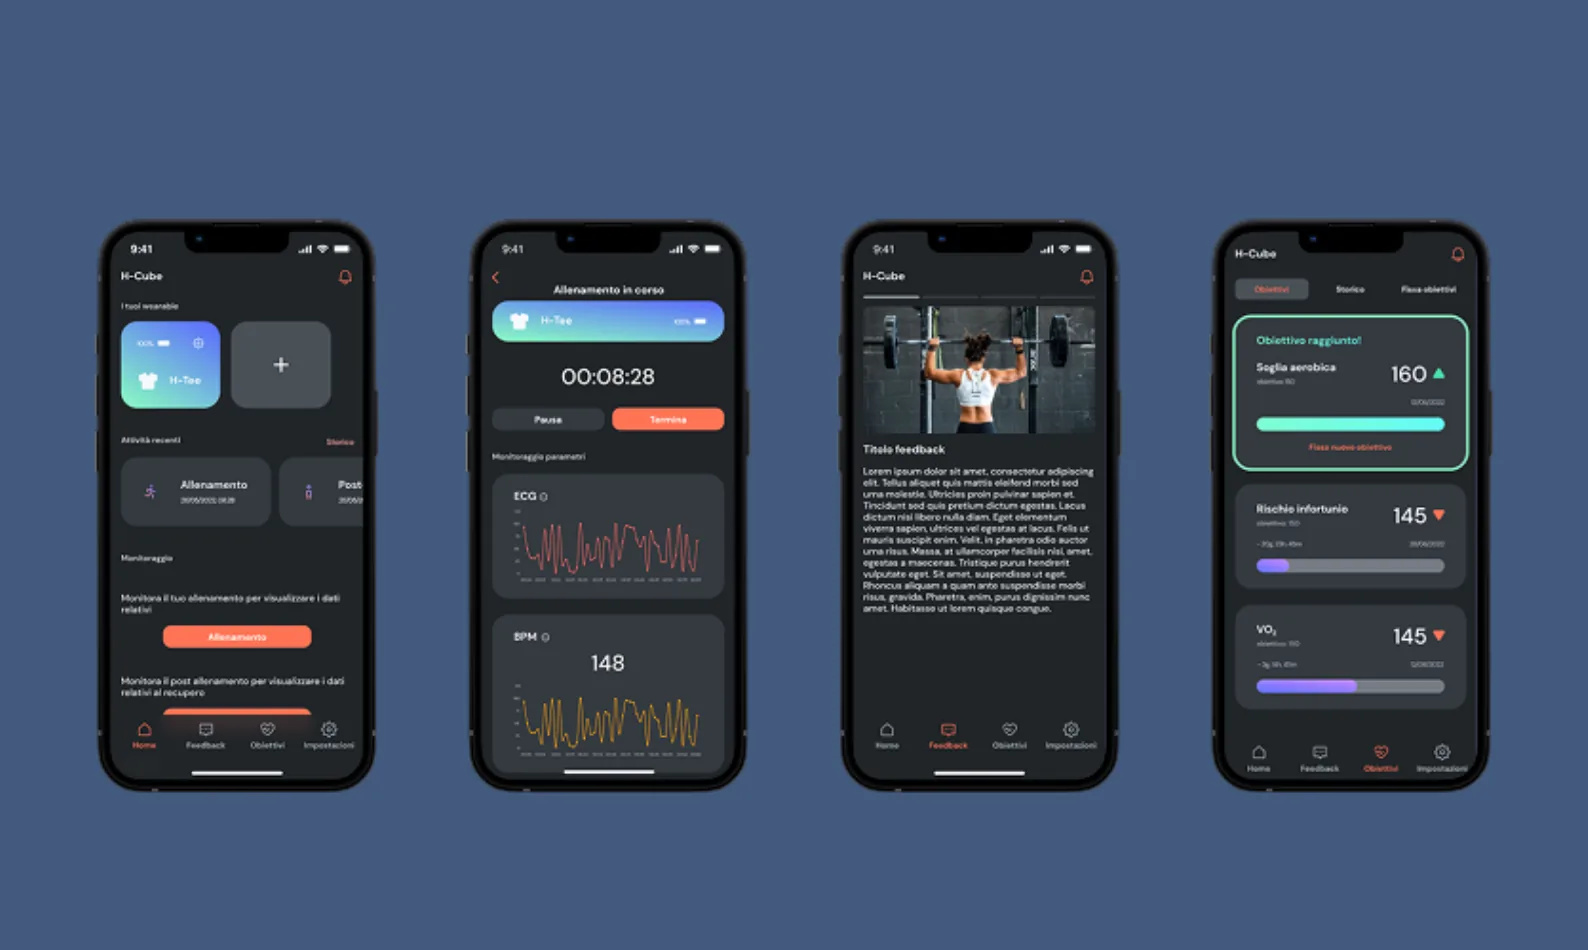
When the session ends, the app's other timescale begins. On top of the history sit the functions that give the data value once the session is closed: trends of improvement or decline, training programmes, assessment of progressions. The history is not all kept the same way: an intelligent compression holds full resolution where it is needed to read a trace back, and aggregated forms for the trend views, which do not need that resolution.
Then there is a layer that concerns people rather than devices: the athletic trainer. They are contacted straight from the app and receive an export of the whole dataset in an analysable format, to assess it and give guidance on how to structure or correct the programmes. It is the step that closes the loop, because a biometric reading on its own says very little.
The results
The result accompanies the athlete on two different timescales. During a session it gives back what is happening while it happens, and the key piece is the ECG replication. Over the medium term it lets them recognise their own room for improvement on precise biometric data rather than on how they felt. The difference between those two things is the entire reason a patch sewn into a shirt needs an app.
A cross-platform app in Flutter 3.0, with native iOS and Android compatibility from a single codebase: full functional parity between the two platforms and a time to market compatible with the hardware validation cycles. The Bluetooth Low Energy communication is tuned to hold continuous high-frequency streams without noticeably affecting battery life, choosing where to sit on the trade-off between latency and consumption through the connection parameters, and hiding the differences between the iOS and Android stacks behind a common abstraction, since those differences surface mostly around permissions, background behaviour and notification reliability. On the data pipeline the constraint was not to lose precision between sensor and chart: samples accumulate in fixed-size circular buffers, which keep memory usage constant even over long sessions, and smoothing algorithms damp movement and contact noise without altering the morphology of the trace. Packet acquisition and parsing stay off the UI thread, so the load of receiving never turns into dropped frames. ECG chart rendering runs at 60 fps on a custom canvas, redrawing only the visible time window. Over the history an intelligent compression keeps full resolution where it is needed to read a trace back, and aggregated forms for the trend views.
A cross-platform app in Flutter 3.0, with native iOS and Android compatibility from a single codebase: full functional parity between the two platforms and a time to market compatible with the hardware validation cycles. The Bluetooth Low Energy communication is tuned to hold continuous high-frequency streams without noticeably affecting battery life, choosing where to sit on the trade-off between latency and consumption through the connection parameters, and hiding the differences between the iOS and Android stacks behind a common abstraction, since those differences surface mostly around permissions, background behaviour and notification reliability. On the data pipeline the constraint was not to lose precision between sensor and chart: samples accumulate in fixed-size circular buffers, which keep memory usage constant even over long sessions, and smoothing algorithms damp movement and contact noise without altering the morphology of the trace. Packet acquisition and parsing stay off the UI thread, so the load of receiving never turns into dropped frames. ECG chart rendering runs at 60 fps on a custom canvas, redrawing only the visible time window. Over the history an intelligent compression keeps full resolution where it is needed to read a trace back, and aggregated forms for the trend views.
- Year
- 2024
- Client
- HCube (a startup incubated at Politecnico di Torino)
Got something similar in mind?
Tell us what you want to build and we will help you find the shortest way there.