IMA: IoT system for data collection and analysis
We transformed an intuition into a PoC that saved 90% of R&D costs.
Industrial automation has historically been the domain of mechanical and electronic engineers. Today, the integration of computer engineering generates value and innovation, unlocking new R&D frontiers.
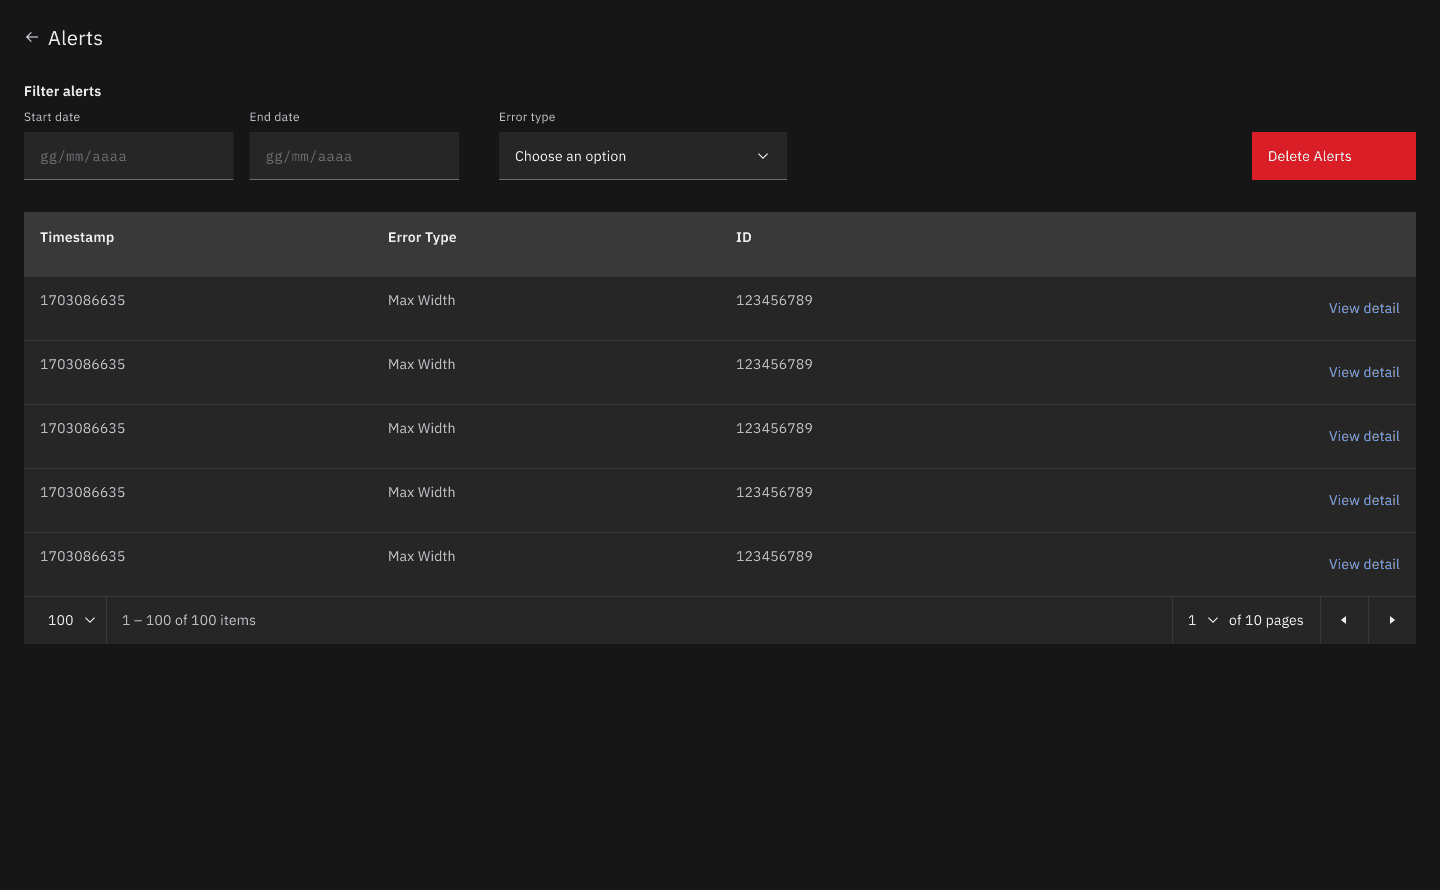
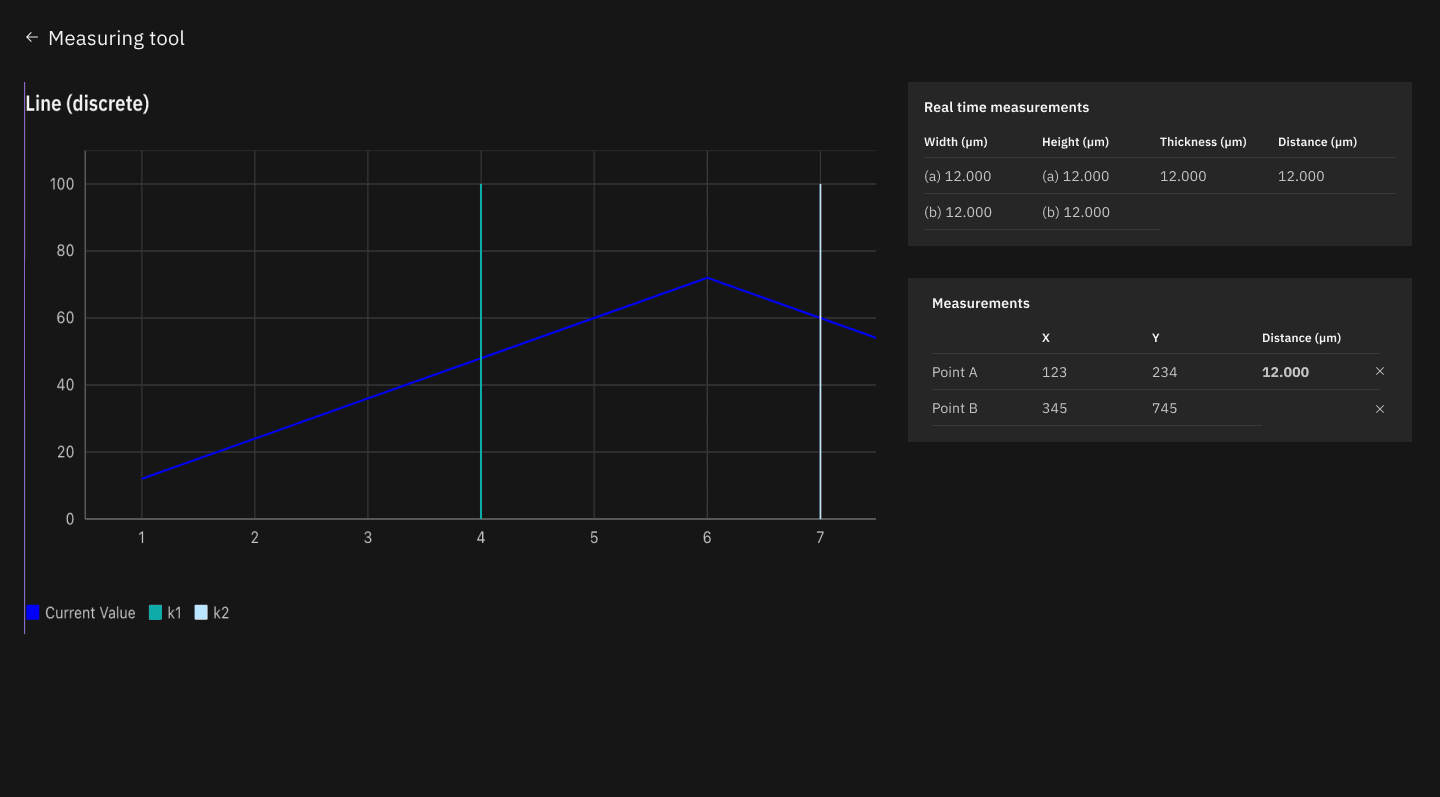
R&D in machinery production has always been costly. Having identified a new quality control machine equipped with an optical laser, IMA's need is to develop a monitoring and data visualization program to enable ideal line automation.


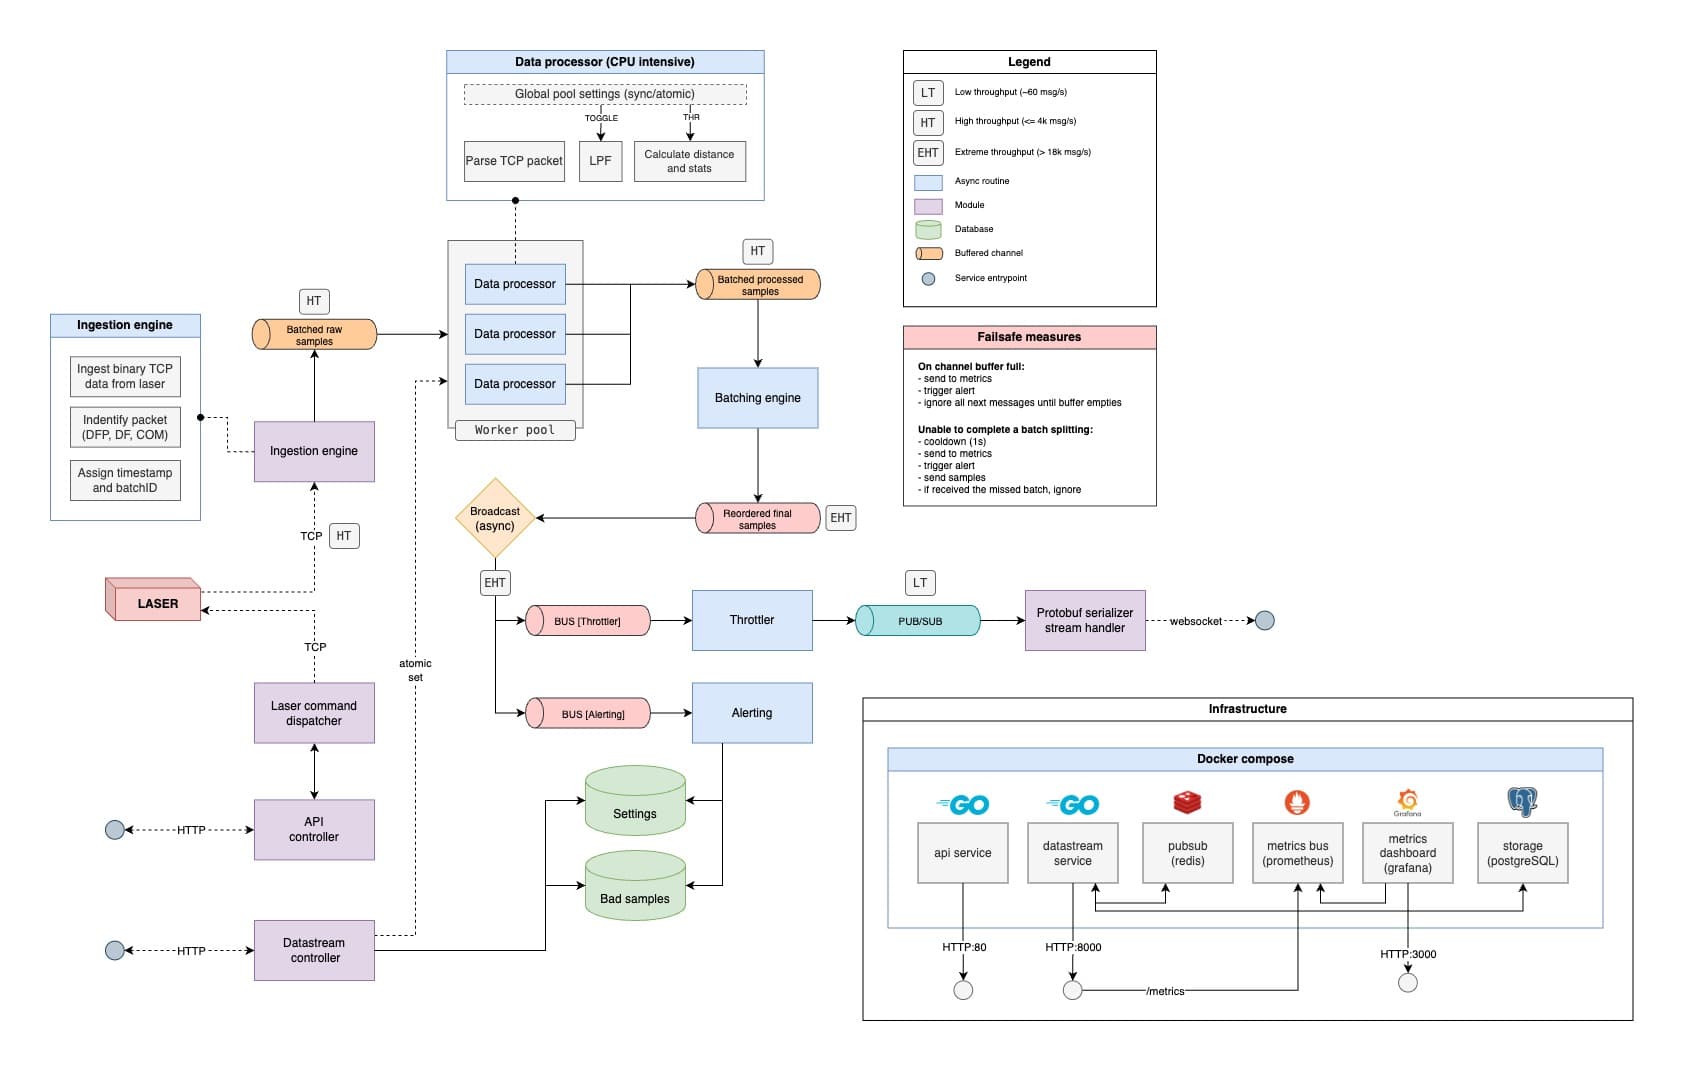
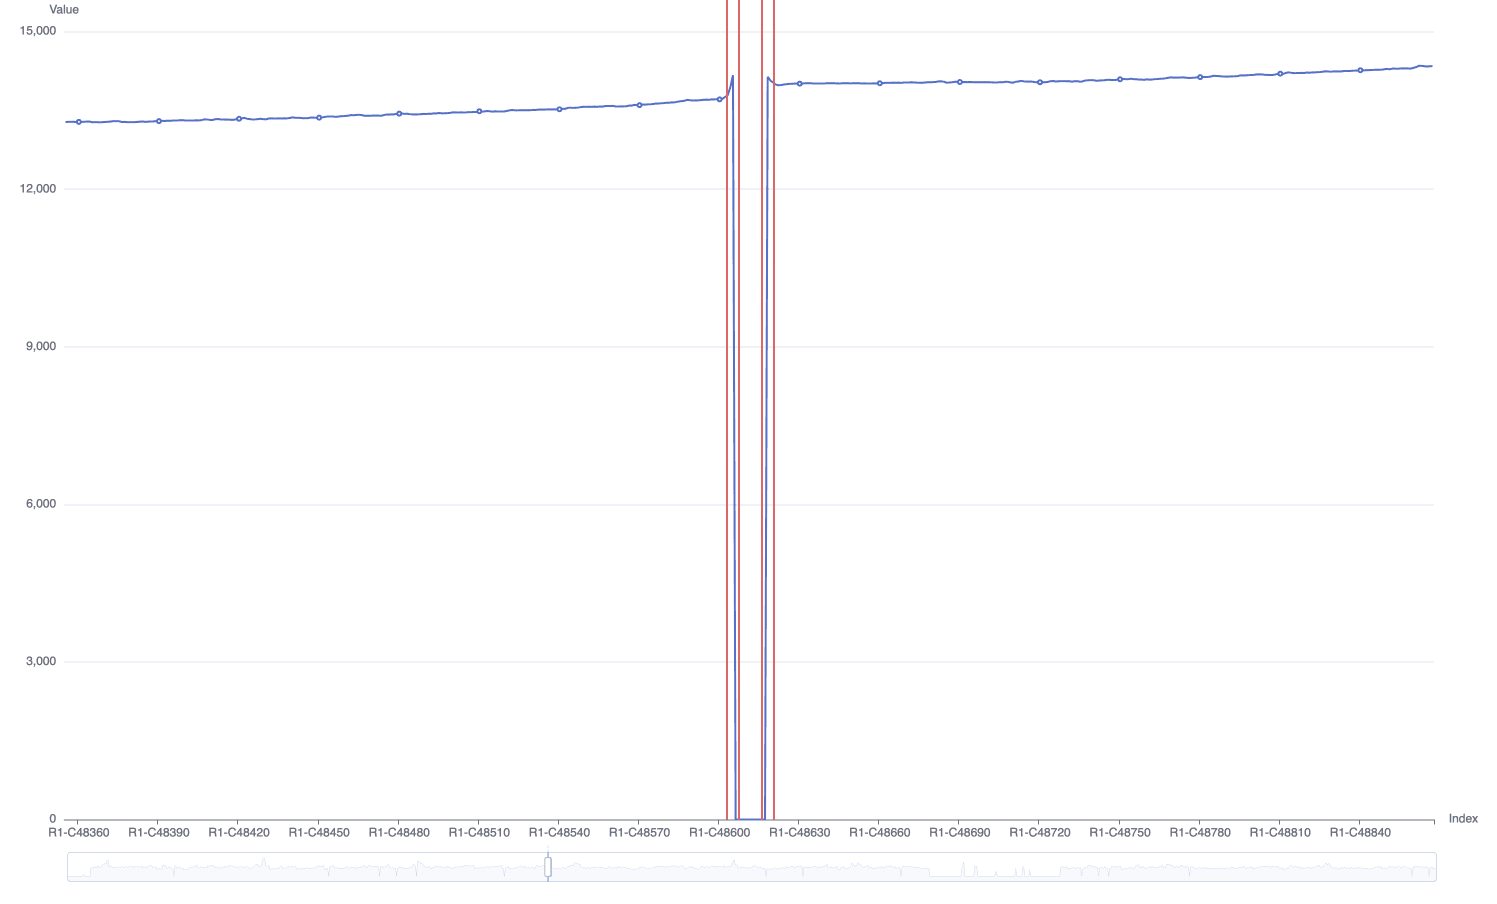
The development of this embedded software is challenging, especially without feasibility confirmations based on the machine's performance. What if it were possible to verify the suitability of the machine for the intended application through a virtual PoC, a testing method capable of streamlining the costs and time of this operation? This led to the Quinck team's intuition to perform this verification through a web-based simulation of the software to be installed on the machine. Thanks to a web-based simulation of the software, it was possible to measure data collection, analysis, and visualization performance, even with very high scrolling speeds.
In this way, IMA was able to verify the suitability of the new machine's performance by investing only 10% of the resources and time required compared to embedded implementation. A few simple steps: development of the simulation algorithm, creation of the interface software, and on-board machine testing with real measurements.
Meddle: AI & IoT at the service of production data
We leverage AI and IoT technologies to simplify and standardize the collection and interpretation of industrial data — empowering manufacturing companies with real-time production insights.
ICP - Meddle and Data Certification on Blockchain
Data validation from IoT platform directly on ICP blockchain
R&W Tech: Web Dashboard for Centralized IoT Machinery Management
We gave a collective brain to 50 welding machines that weren't talking to each other
EVENN: Neighborhood Services App
Mobile marketplace for sharing neighborhood services with time-based currency system
Autoctono: Wine E-commerce
The digital ecosystem that transforms the purchasing experience for the wine community.
Data Warehouse: Anti-Money Laundering System
Computerized database for data storage in compliance with anti-money laundering regulations
CHARGECAR: Electric Charging Station Finder
Backend for mobile platform aggregating multiple electric vehicle charging providers
HCUBE - HTees Project: Sports Wearables
Mobile app for vital parameter monitoring via innovative patches applied to sportswear
Non così raro: Clinical Screening
Web platform for diagnostic kit logistics management in hospital clinical trials
Agrinsight: AgriTech Platform for Remote Orchard Management
Remote monitoring and digital management for intensive orchards
NETECH: Banking Calibration Management
UX/UI redesign of platform for anti-money laundering controls in banking environment
WEP: Custom Global e-commerce
Transform a travel catalog into a machine for generating personalized experiences
VERNICE: Neural Network for Paint Mixing
Machine learning system to predict paint formulas from specific colors in RGB format
FFRI: Artificial Intelligence and Fashion
AI tool for enhancing and blending historical textile patterns
Satispay: Corporate WebApp
When one of Europe's most innovative fintechs asks you to build its new digital home